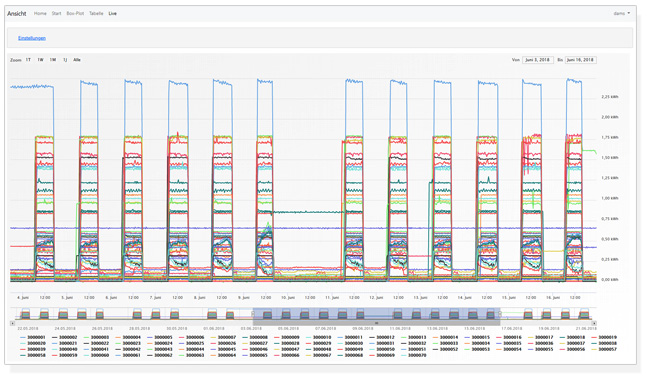
In speedikon® C, it is now possible to work with live data from your facilities. Until now, our clients have been using analyses that where surveyed in certain intervals, hence, the data of the facility was always retrospective. With speedikon® C version 5.1, you can monitor live data from sensors in a chart that is updated constantly.
The amount of data that is displayed in the chart at the same time is only limited by the resolution of your monitor. X- and Y-axis can be scaled on-the-fly. Therefore, cut-outs of the data streams can be visualised and surveyed very quickly. In order do reduce the number of arrays and to make them more manageable, virtual lines can be created. For this purpose, an easy-to-handle interface, which makes it possible to add arrays, can be used to determine minimum and maximum as well as the average peaks. Tests with a large number of arrays and data points have proven its performance and usability.
Thanks to live data, new possibilities open up in the field of facility management, as configurable alerts can induce facility operators to intervene immediately, for instance, when figures differ from ideal numbers. Therefore, this new module increases the efficiency of your facility.
With the help of Live Charts, you can, for example, monitor the temperature of an oven. Determine an ideal temperature range and then you can monitor the degrees in the live charts. If the temperature rises or falls, so that the figure is not in the defined range, an alert can notify you, which makes an immediate intervention and adjustment possible. An automatic intervention because of aberrations can be automated by WiriTec for you if necessary.
The offline version of Live Charts, which shows existing data, runs -as all our programmes – exclusively on a browser and is implemented with Angular. Hence, after loading, only the client’s computing capacity is used, and the network is not overburdened with mounds of data. We copy arrays from the data base into a simple structure that is filed in the memory. Depending on the amount of data and the performance of your computer, this can take a few minutes. If the data is available in the memory, charts can be edited in a split second.
If you have any questions concerning our new feature, please contact us.