Whether for correcting defects or for planning: you can receive helpful information on our DCIM platform DAMS C . Its network reports, in shape of graphics or lists, can show you where servers and patch panels are located and how they are interconnected; or you can find out how many and which kind of connections are in your network.
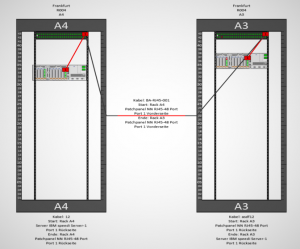
This turns out to be particularly useful if there is a problem in a data centre that is caused, for example, by a defective cable. In DAMS C, the route of a cable can be traced and visualised graphically. Moreover, it can be analysed what kind of connections there are – if there is a copper or optical fibre connector, for instance. These kinds of defects can be localised and corrected quickly with help the of the reports.
Additionally, the installation of a new server can be planned optimally with our tool. Find out which server racks are occupied and find free slots that offer the right space for new servers. Is the power supply suitable? The cooling as well? In the next step, you can give the technician a report of the connections and the new server can be launched soon.
Would you like to know more? Visit our DAMS C websites or contact us!