With the constant increase in information in facility management, analyzing large amounts of data is very important when it comes to making well-founded decisions, optimizing operational processes or quickly creating the basis for procurement tenders. This is where the evaluation engine in speedikon C comes in – a tool that provides you with optimal support when evaluating large data sets.
Features of the Analyses Engine
The Analyses Engine offers a wide range of evaluation and analysis functions for master data as well as in the modules maintenance, ticketing, visitor registration, user manager, lock & key management and soon also in contract and rental management.
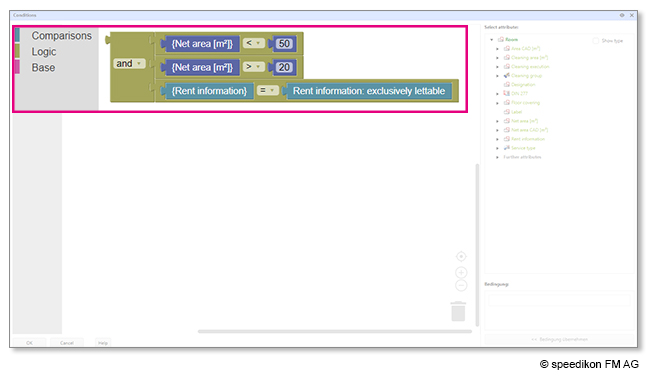
Perform complex analyses with Blockly
The integration of Blockly is particularly helpful. It’s a visual programming tool that makes even complex queries and evaluations simple and user-friendly. For example, with just a few clicks you can display all rooms that are between 20m2 and 50m2 in size and can be rented out.
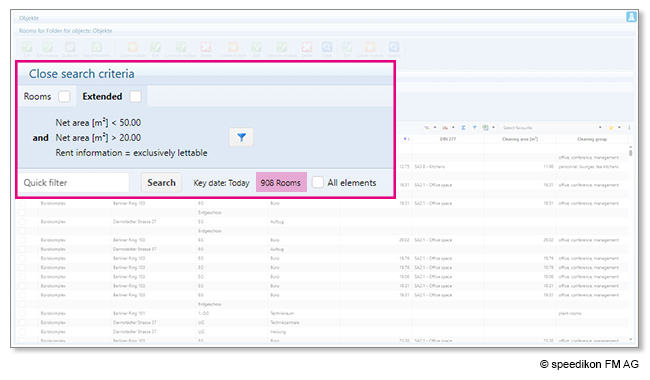
Before applying the Blockly evaluation, every room stored in the software and their attributes is displayed.
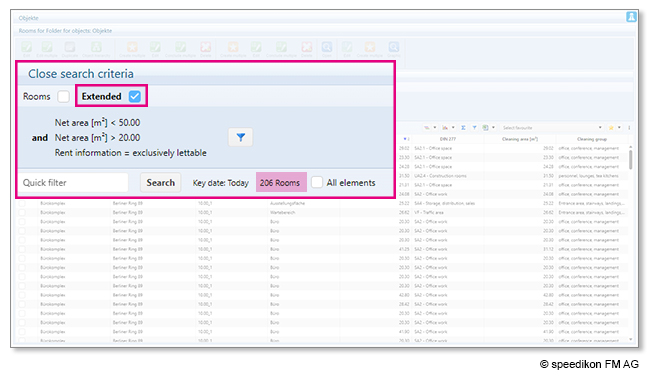
After activating the analysis created in Blockly, all rooms that are between 20m2 and 50m2 in size and are free to rent are displayed. And since the room attributes, such as net or cleaning area, also appear, these are automatically added up. This is particularly helpful for procurement tenders, as you can export the analyzed data to Excel, for example, to make it quickly available to your service provider for the preparation of an offer.
For less complex searches, the quick filter is also an option. There you can easily display all your buildings that are located in the same street, for example, or rooms that are assigned to a specific cost center.
Grouping data sets
With the column grouping you get a better overview of your data. Instead of seeing all the rooms in your buildings below each other in a list, you can use the grouping function to display the number of rooms in each building at a glance, for example. This way you immediately know which building has how many rooms.
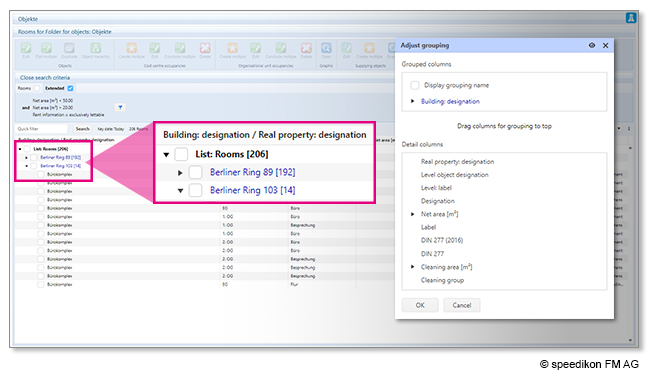
The grouping can be extended by any number of columns, so that in addition to the number of rooms in your buildings, for example, all unrented rooms are also displayed. In this way, you can uncover untapped potential if, for example, the unrented rooms were left empty unintentionally.
Visualizing results in diagrams
In addition, the evaluation engine offers various types of charts, including pie, column, line, area and bars, which provide a visual representation of your data. This helps in understanding your data better and communicating your results to your colleagues. Exporting all analyzed data for further processing to other software solutions is also possible.
Want to learn more about the Analyses Engine? Have a look at our free webinar at this link (only available in German).
Do you have specific questions? Then contact us at +49 (0) 6251 584 0 or by mail at info@speedikonfm.com to talk to one of our experts – no strings attached!