With the ever-increasing need for businesses to be more energy-efficient and cost-effective, it’s crucial to keep a close eye on your energy consumption. But, communicating this data across different departments and management levels can be a daunting task. That’s where the new functions of our WiriTec dashboards come in.
Our energy monitoring software has been updated with cutting-edge dashboard features that allow you to easily configure and customize them to suit your specific needs. With individual functional enhancements and streamlined configurability, you can create and edit dashboards in no time, and get the data you need immediately. These dashboards are the perfect tool for any business looking to optimize their energy consumption and reduce costs while making a positive impact on the environment. Read on to discover the new dashboards!
Revamp the way you visualize your energy consumption with our exciting new traffic light graphics
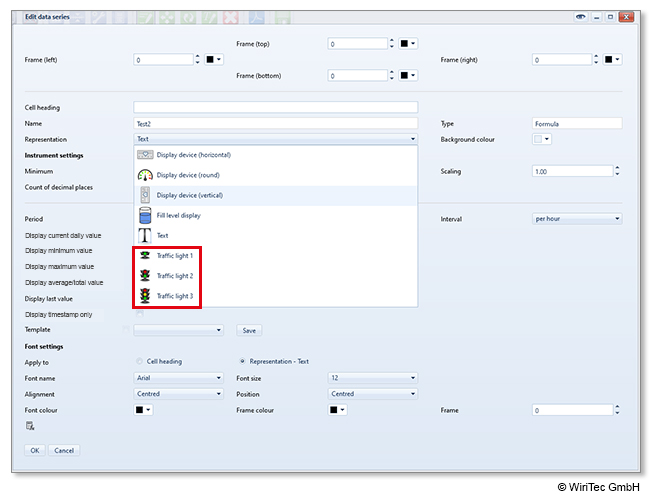
With our dashboards, you can configure these graphics to display one, two, or three lights and assign them to specific consumption values. Imagine how powerful it would be to see a red light flashing if consumption exceeds a certain threshold! Our traffic light graphics are a game-changer in terms of visual appeal and efficiency, enabling you to quickly and easily track your energy consumption.
But that’s not all – our traffic light graphics also offer complete customization, allowing you to match the housing color to your brand or decor. This feature ensures that your dashboard looks just as impressive as it performs. Say goodbye to dull and complicated consumption tracking and hello to our sleek and user-friendly traffic light graphics.
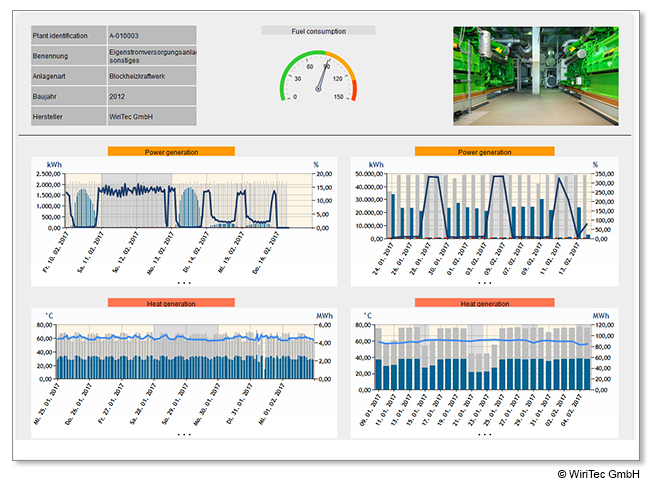
Experience the power of value comparison with our latest dashboard feature
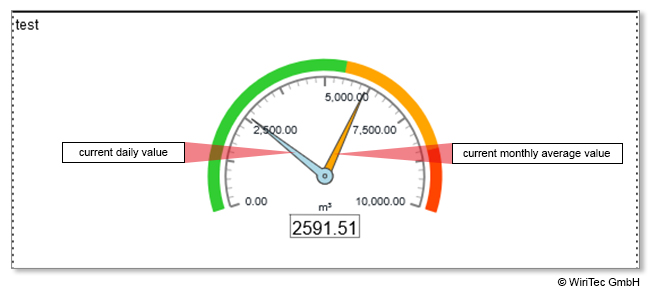
With our dashboards, you can now view values from different time periods side-by-side, giving you a comprehensive overview of your data. For instance, circular instruments can show the current value as well as the total value for an entire month, all in one display. And if you prefer a cleaner look, you can even hide the current value altogether.
Furthermore, our new time selection feature lets you define a custom time selection for each chart in the dashboard. This means you can have the same chart displayed twice, each showing values of different time periods, without having to change the entire dashboard. It’s incredibly helpful for businesses that need to compare data from different time periods, making it easier to spot trends and analyze patterns.
Never miss a beat with the timestamp
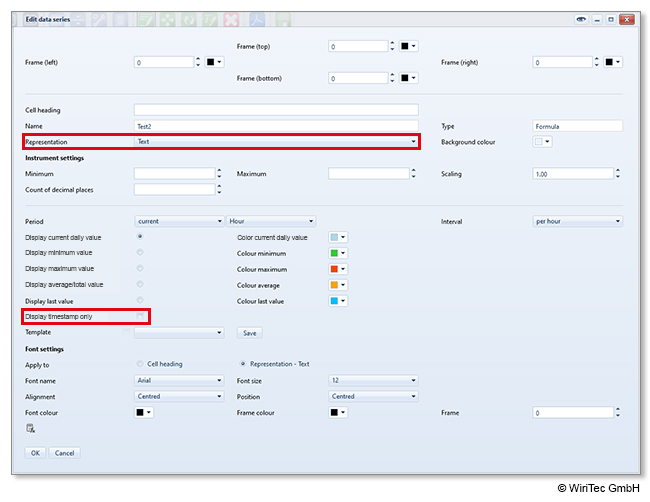
Our dashboards now display the timestamp of the last transmitted values to the WiriTec system. This feature ensures that you always have the most up-to-date data at your fingertips, giving you peace of mind and confidence in your decision-making. Plus, in case of transmission failures, you can quickly pinpoint the issue and take corrective action early on.
And the best part? Our transmission frequency is fully customizable, so you can tailor it to your business’s specific needs. Whether you need data transmitted every minute or every quarter-hour, our dashboard can handle it all.
Creating and editing dashboards has never been easier
Our latest update simplifies the process, giving you full control over your dashboard’s layout. You can now effortlessly add and move sheets and columns, and rearrange the order of sheets with just one click. It’s never been easier to tailor your dashboard to your exact needs.
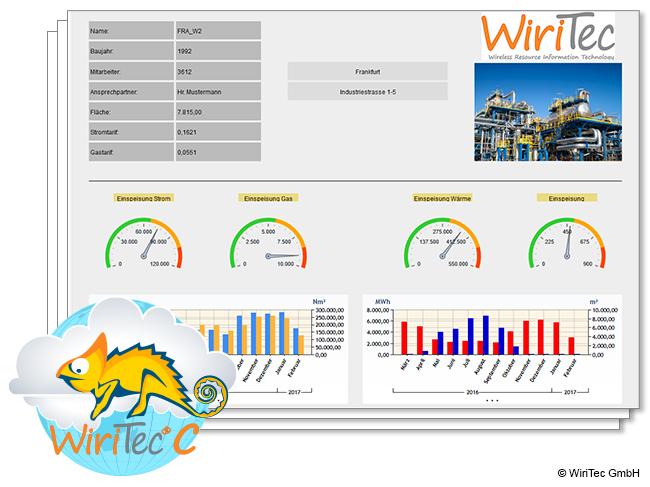
Make your dashboards more user friendly with images and logos
We’ve also added a new feature that lets you include images and logos in your dashboard. This not only adds to the visual appeal but also enhances the user experience, making it easier for employees who don’t use the WiriTec software regularly. With these new features, you can make your dashboard more intuitive, all while conveying vital information at a glance.
Are you tired of static charts that don’t reflect real-time data? Our new dashboard update has got you covered!
With our IFrame function, you can now easily integrate live charts into your dashboard. This means you can view your data as it’s happening, allowing you to make more informed decisions in real-time.
The WiriTec C update has everything you need to optimize your company’s energy consumption and reduce costs. Our new dashboards offer unparalleled flexibility, giving you the power to quickly identify and solve energy problems before they become major issues. With features like live charts, traffic light graphics, and the ability to display values from different time periods, you’ll have all the information you need at your fingertips.
Invest in the future of your business with WiriTec C. Don’t let energy inefficiencies hold you back any longer – contact us today at 00496251 584 0 or info@wiritec.com to learn more about our powerful new dashboards. Or, click here to check out all the details on our website. The future of energy efficiency starts now – join us and start saving today!