In todays blog post we would like to introduce you to a new function available within the energy management – the box-whisker-plots.
When it comes to analysing performance indicators the often used bar charts and line diagramms are usually not good enough as they cannot properly display the scattering of all the values. The scatterplot is on the other hand not appropriate for comparing various time periods.
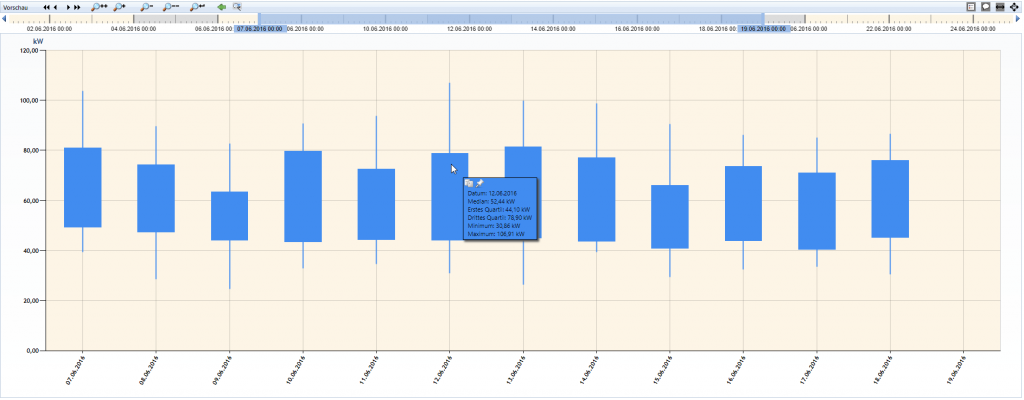
In order to breach this gap, we have decided to introduce box-whisker-plots. Generally speaking, a boxplot consists a box in the center and two lines extending vertically from this box. These lines are called whiskers and their ends display the minimum and maximum values.
These boxplots enable the user to easily analyse the degree of dispersion of individual values and compare them to values from other time periods.
We have equipped the chart component with additional methods in order to display the min- and max-values (the whiskers). Further, the upper and lower quartile as well as the median are automatically calculated. Since these functions are built-in, all the user has to do is select the intervall and the resolution; the chart and its logic will take care of the rest.
This function is avaiable from the WiriTec C version 4.1 onwards.