Last week we looked at where the data needed to increase energy efficiency actually comes from. This week we turn our attention to the live monitoring and evaluation of this data.
An energy data management system must be able to take in many millions or even billions of data records and make them available for analysis in the shortest possible time. With our WiriTec software, you can display these values clearly and put them into a temporal and logical relation with each other. At the same time, because the quality, i.e., the correctness and plausibility, of all data and all processes based on this data must be guaranteed, we have developed various tools to support you in this task.
With the data connector, the data is formally checked for plausibility: it is checked whether the value is transmitted at all and whether it is transmitted from the correct source. In addition, the Watchdog checks the content of the data, and checks whether certain value limits are adhered to, which are defined by the client based on experience and historical data.
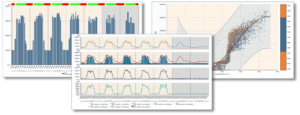
If deviations are detected during the monitoring of the data, our WiriTec software offers a number of tools and functions that provide the user with unique evaluation flexibility to track and resolve the deviations. For the evaluation, our WiriTec software does not pre-calculate data, but prepares and graphically displays it at the time of evaluation according to the selected time periods and intervals – even large amounts of data can be displayed in an easy and fast way.
Accordingly, with the help of the integrated chart component, the user can perform a variety of different graphical data evaluations, such as status bars, multiple charts or scatter plots, among others. All data to be evaluated is fetched live from the database, which ensures a high degree of flexibility. Once configured, charts can be saved and updated with current data and retrieved at any time.
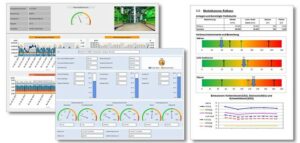
Since reports are typically already created in a standardized way according to the respective company specifications, they only need to be fed with reliable data in an optimized way. Here, too, WiriTec can support you with a very powerful report generator. With this tool, the creation of even the most complex reports is possible in a very straightforward way. For example, various dashboards can be created for the individual buildings, in which the energy consumption of the last months or even years can be displayed. Other information can also be displayed, such as the address or the exact square meters of the respective properties. This provides an information overview per building, with the help of which the client can directly detect high deviations in energy consumption and intervene.
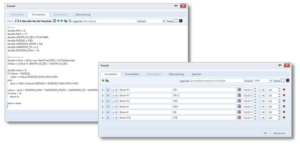
Another innovative and powerful tool is the formula editor, which allows the in-depth analysis of measurement data and the mapping of mathematical relationships between measurement data and characteristics of buildings, machines and plants.
Starting from the simplest summations up to the most complex mathematical calculations, the formula editor is a powerful analysis tool with which you can deeply examine and evaluate your data.
All these tools provide reliable evaluations that help you not only to make the right decisions regarding the increase of your company’s energy efficiency, but also to use the obtained data for other departments of your company, such as accounting – a topic we will discuss in more detail in the next blog post of our mini-series.
Would you like to learn more about the features of our WiriTec software regarding the evaluation and monitoring of data in real time? Then send us an email at info@wiritec.com or give us a call at +49 6251 58350.