We want to focus with today’s blogpost on one of many extensive evaluation possibilities within WiriTec® C: the day analysis.
Displaying measuring data and consumption data in consecutive periods and time ranges is a typical scenario within professional Energy Management. Thus, evaluations are created with daily, weekly, monthly or yearly periods. Individual consecutive weeks or months are compared to identify deviations from nominal conditions. Carpet plots allow extensive evaluations of very long periods.
What happens when these time ranges/days are widely apart? For instance, in the case of bank holidays. This makes evaluations with normal charts difficult if not impossible.
We have created with the so-called day analysis an evaluation tool, that helps our customers to tackle this problem. This tool allows comparing individual bank holiday days and further specific key days with average values of any reference period.
Therefore, the considered days are selected in a calendar via a mouse click. If required, these days can be further described/designated within the legend. In the next step the data series is selected, and the evaluation interval set. The chart is then automatically created.
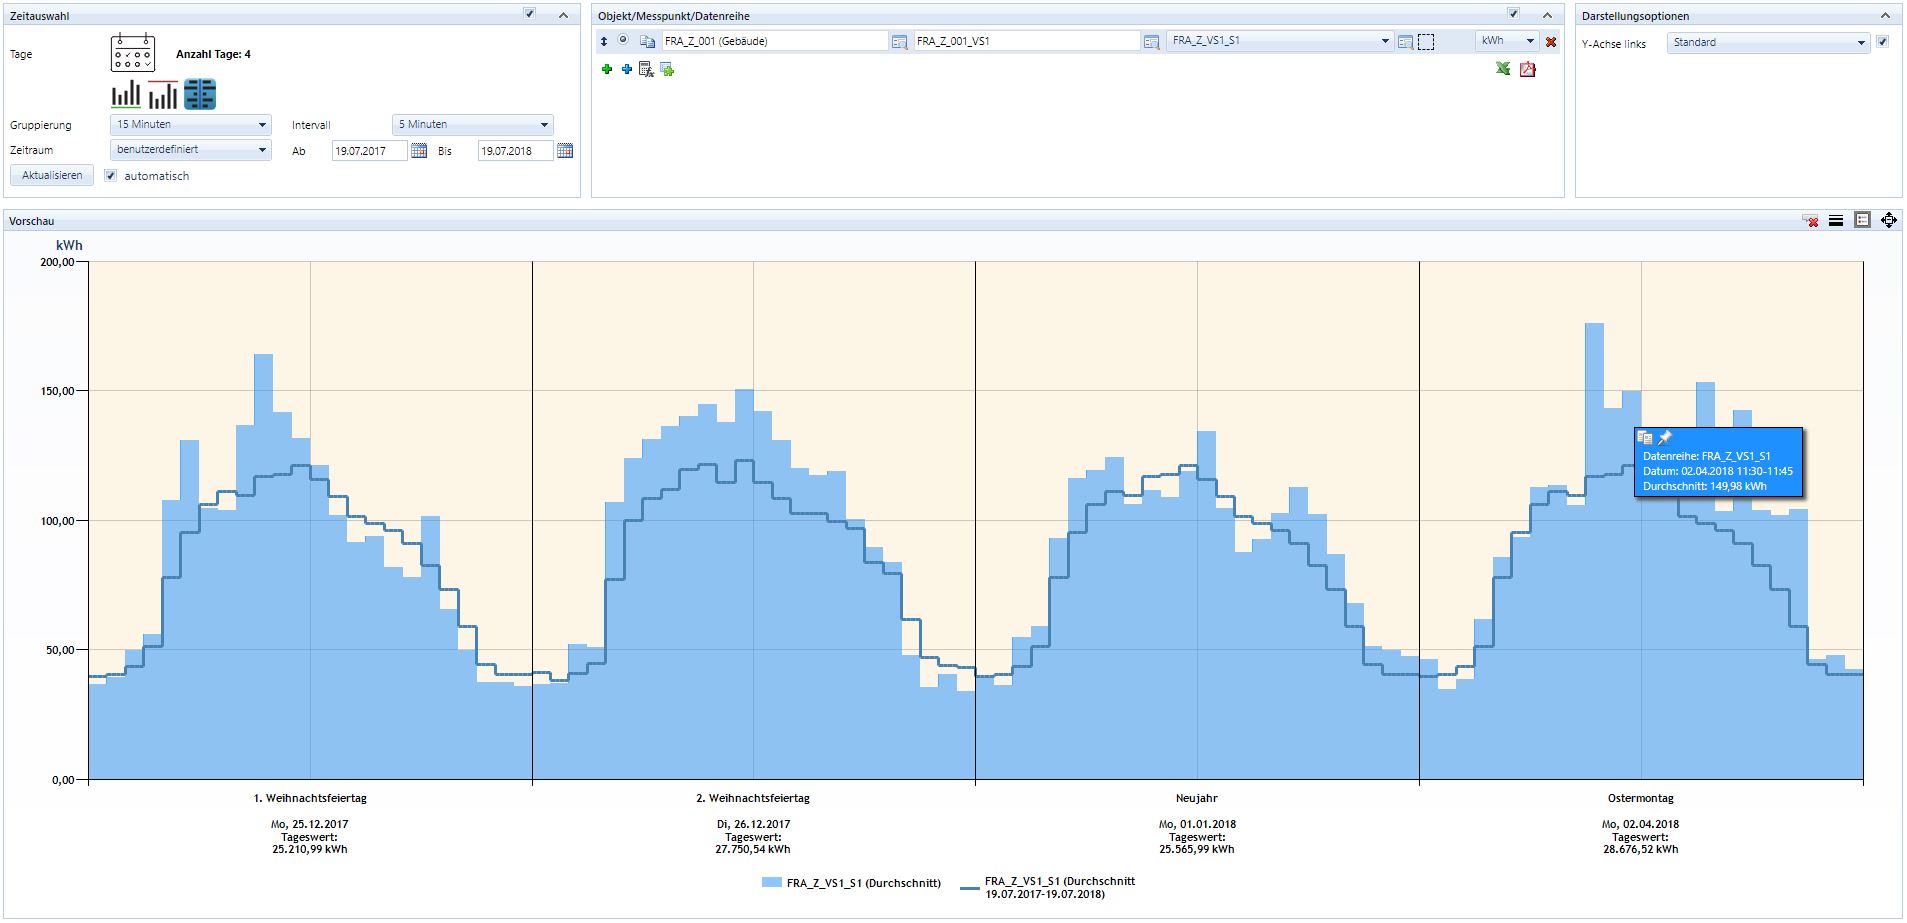
The blue bars display the values of the selected days. The blue line displays the average value – including a special feature! It displays the average value of the weekday on which the bank holiday was. This is executed within a freely definable time range. In this example Christmas Day (in 2017 a Monday) is compared with the average values of Mondays in a time range from 19.07.2017 – 19.07.2018. This allows the user not only to compare bank holidays with each other but also to display deviations between typical weekdays.
This function is available for all our customers as of the release version WiriTec® C 4.1.