Power consumption in Data Centers is growing exponentially these days. One reason is the pandemic situation with countless meetings and conferences held in digital form exclusively. Another key factor is the significant rise of digital currencies. Thus, Bitcoin only consumes more energy than Belgium and New Zealand together.
In 2017, Bitcoin’s power consumption was around 6,6 terawatt hours per year, whereas in October 2020, the consumption roared up to 67 terawatt hours, to nearly double in 2021 by reaching 121 TW/h. As a matter of consequence, CO2 footprint simultaneously increases drastically. To counteract this trend, an efficient, well focused Energy Management is the name of the game in Data Centers nowadays.
Our DAMS C platform provides exactly the necessary tools and manifold reporting options to master those challenges Data Center Operations Managers face today and, above all, in future. In this context, DAMS C Energy Data Management module fulfills two major tasks, i.e. taking over and processing all consumption and sensor data as well as measured values on one hand, and monitoring and visualizing all values collected on the other.
With respect to capturing data in Data Centers, SNMP has made its way to become the standard format for data exchange, as the majority of measuring components masters this “language”. Apart from this standard, and as a matter of fact, DAMS C is also able to handle other relevant field protocol types such as M-Bus or ModBus. As a clear benefit, this enables users not only to take over measured values and sensor data, but also the seamless processing of both condition or status data directly from the field level.
However, having the huge amount of captured data alone is not a benefit in itself, if this data is not elaborated and clearly visualized. To achieve this goal, we make use of the wide range of reporting tools incorporated in the WiriTec C platform to join them to the Data Center specific functionalities DAMS C provides to customers.
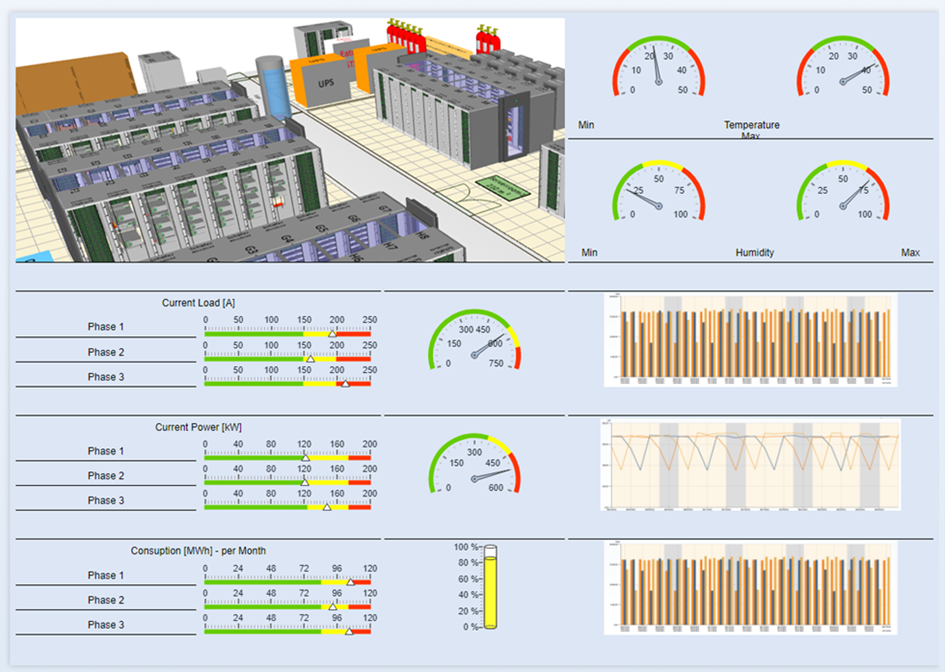
This image shows a typical DAMS C dashboard for Data Centers allowing customers to elaborate alphanumerical data also graphically by using serial data curves, sliders or level indicators, for instance, and subsequently qualifying those data by color scales. Trained users can easily create their dashboards independently.
It goes without saying that measured values, traffic-light-symbols or any other useful graphical representations can directly be indicated in the 3D graphics of the Data Center. Thus, you can identify existing hotspots immediately or display the status of a rack door.
However, it is fairly impossible for users to keep their eyes permanently on hundreds or even thousands of data records every day. That is why DAMS C Energy Management includes also automated monitoring methods. Thanks to powerful rule sets, all data or only the most relevant data is permanently checked on keeping defined value bands, target- or also limit values. In case of discrepancies detected, respective notifications will be sent to users.
It is as important to Data Center operators to have reliable KPI’s such as PUE, DCE, CUE or EUE as knowing the overall absolute energy consumption of the Data Center. That is the reason why we are using the methods ot the WiriTec C formula editor to create any type of mathematical relations.
In case you want to know more about our high performing Data Center Management platform DAMS C, please do not hesitate to contact us directly.